
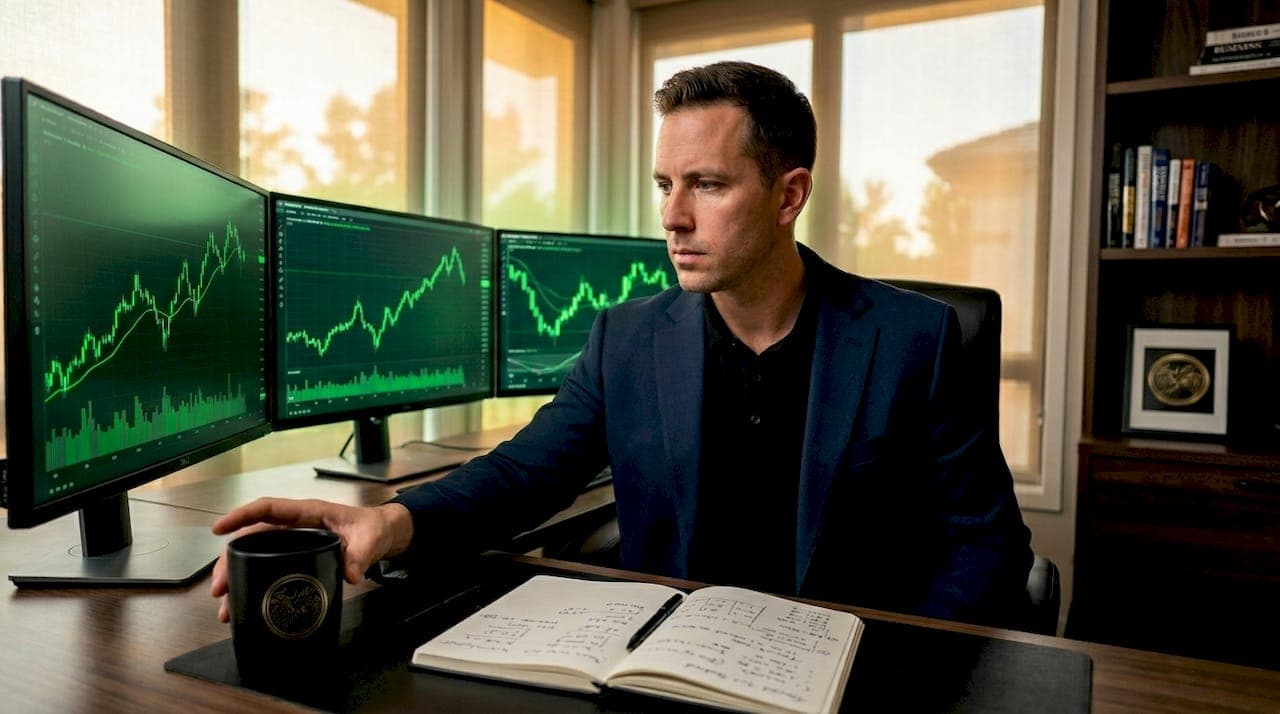
Most traders don't fail because they lack information. They fail because they have too much of it, poorly organized. Understanding the types of trading signals available is what separates traders who act with conviction from those who second-guess every entry. Signals, formally called trading indicators or market signals in professional contexts, are the structured triggers that inform buy, sell, or hold decisions. This guide walks through the major categories, how to evaluate them, and how to combine them without drowning in noise.
Table of Contents
- Key takeaways
- Types of trading signals: how to evaluate before you use them
- 1. Moving average and trend signals
- 2. Momentum signals
- 3. Volatility signals
- 4. Volume-based signals
- 5. Chart pattern signals
- 6. Fundamental analysis signals
- 7. Sentiment signals and market psychology
- 8. Quantitative and algorithmic signals
- 9. Signal comparison by category
- What experience actually teaches you about trading signals
- How Apextradellc puts these signals to work for you
- FAQ
Key takeaways
| Point | Details |
|---|---|
| Four core signal categories | Trading signals fall into technical, fundamental, sentiment, and quantitative types, each serving a distinct role. |
| Combine fewer signals better | Research supports using 2 to 4 complementary indicators rather than piling on redundant ones. |
| Good signals include risk levels | A quality signal specifies direction, entry, stop-loss, and take-profit levels, not just a directional bias. |
| Latency matters for execution | Real-time signals lose value fast without low-latency infrastructure to act on them. |
| Sentiment signals are contrarian tools | Crowd positioning data often points to opportunity in the opposite direction of the majority. |
Types of trading signals: how to evaluate before you use them
Before surveying the individual categories, you need a framework for judging any signal you encounter. Trading signals categorize broadly into technical, fundamental, sentiment, and quantitative types, but that taxonomy alone doesn't tell you whether a specific signal is worth trading.
Evaluate every signal against these criteria:
- Source and methodology: Is the signal rule-based, model-generated, or discretionary? Rule-based signals allow rigorous backtesting, while discretionary ones do not.
- Timeliness: Does the signal arrive with enough lead time to execute, or is it a lagging confirmation that the move already happened?
- Risk specification: A complete signal specifies direction plus entry, stop-loss, and staged take-profit levels. Anything less is incomplete.
- Complementarity: Does this signal add new information, or does it duplicate what you already have?
- Execution latency: Sub-15ms cloud executions are now the benchmark for real-time signal capture. Desktop relay systems routinely introduce delays that erode profitability.
Using too many signals from the same family creates a false sense of confirmation. Three momentum indicators all saying "buy" is one signal repeated three times, not three independent reasons to act.
Pro Tip: Build your signal stack like a basketball team: you want players with different skills, not five centers. Pair one trend signal, one momentum signal, and one volume signal before adding anything else.
1. Moving average and trend signals
Moving averages are the oldest category of trading signal still in active use, and for good reason. They smooth price data over a specified period and generate signals when price crosses above or below the line, or when two moving averages of different lengths cross each other.
The 50-day and 200-day moving averages are the most widely watched. A "golden cross," where the 50-day crosses above the 200-day, has historically preceded sustained bull runs in equities and crypto. The opposite crossover is called a "death cross." The Moving Average Convergence Divergence indicator (MACD) builds on this logic by measuring the distance between two exponential moving averages and plotting a signal line against that distance.

Trend signals shine in trending markets and produce false positives in choppy, range-bound conditions. That limitation is not a flaw in the signal. It is useful information about market structure.
2. Momentum signals
Momentum indicators measure the speed of price change rather than its direction. The Relative Strength Index (RSI) is the standard, scaling from 0 to 100. Readings above 70 traditionally indicate overbought conditions; readings below 30 suggest oversold conditions.
The Stochastic Oscillator works on similar logic but compares closing price to a price range over a set period. Both are most useful when diverging from price. If price makes a new high but RSI makes a lower high, that divergence is a much more powerful signal than a simple overbought reading. Divergences tell you momentum is fading before price confirms it, which is a genuine edge.
Pro Tip: Don't use RSI in isolation during strong trends. In a persistent uptrend, RSI can stay above 70 for weeks. Use it to identify divergence, not as a standalone buy or sell trigger.
3. Volatility signals
Volatility signals measure how much price is moving, not which direction. Bollinger Bands place two standard deviation lines above and below a moving average. When bands tighten, the market is compressing, and a breakout typically follows. When price touches the upper band repeatedly without retreating, that is a sign of strength, not a shorting opportunity.
Average True Range (ATR) quantifies volatility in price terms rather than visual width. Traders use ATR to set stop-loss distances that match current market conditions rather than arbitrary fixed points. A 20-pip stop in a market with an ATR of 80 pips will be stopped out by noise before the trade has a chance to develop.
4. Volume-based signals
Price tells you what happened. Volume tells you how many people cared. On-Balance Volume (OBV) accumulates volume on up days and subtracts it on down days, creating a running total. When OBV trends up while price consolidates, institutional buying is likely occurring beneath the surface.
The Volume Weighted Average Price (VWAP) is the standard benchmark for institutional execution desks. Price trading above VWAP during a session signals bullish intraday sentiment. Retail traders use VWAP as a dynamic support and resistance level. Combining trend, momentum, and volume indicators in a complementary stack gives more reliable market insight than loading up on similar indicator types.
5. Chart pattern signals
Chart patterns are a visual category of technical signal. They represent recurring market geometries that carry statistical tendencies, not guarantees. Common patterns include:
- Head and shoulders: A reversal pattern signaling the end of an uptrend, confirmed when price breaks below the neckline with volume.
- Ascending and descending triangles: Continuation patterns where price coils before breaking in the direction of the prevailing trend.
- Bull and bear flags: Short consolidations on high-volume moves, usually resolving in the direction of the initial thrust.
- Double tops and bottoms: Reversal structures where price tests a key level twice and fails, signaling exhaustion.
Chart patterns require discretionary judgment to identify, which makes them harder to backtest than indicator-based signals. Their value lies in framing where price is likely to go, not in generating precise entry triggers on their own.
6. Fundamental analysis signals
Fundamental signals operate on a different time scale entirely. They are driven by economic data, corporate earnings, central bank decisions, and geopolitical events, and they inform position-sizing decisions for swing and position traders more than they guide day-trade entries.
Key fundamental signals to track include:
- Interest rate decisions: Central bank rate changes affect currency valuations, equity multiples, and bond prices across every asset class.
- Inflation data (CPI, PCE): Inflation readings shape rate expectations, which then cascade into technical price action.
- GDP and employment reports: Broad economic strength or weakness signals directional bias for entire sectors.
- Earnings surprises: When a company beats or misses revenue and earnings estimates by a wide margin, it creates sharp, tradeable price dislocations.
- Geopolitical events: Trade policy shifts, elections, and conflicts create event-driven fundamental trading scenarios that override technical patterns in the short term.
The practical combination is this: use fundamentals to decide which direction you want to be positioned, then use technical signals to find your entry. You get the wind at your back from the macro picture and precision from the chart.
7. Sentiment signals and market psychology
Sentiment signals measure what other traders are doing, not what the price is doing. Their predictive value comes from the fact that extreme crowd positioning is usually wrong at turning points.
Useful sentiment indicators include Commitment of Traders (COT) reports, retail positioning data from brokers, put/call ratios on options markets, and fear/greed indices. When retail traders are overwhelmingly long a currency pair, the smart-money trade is often to look for shorts. The crowd is frequently right during trends and wrong at extremes.
Sentiment signals are most valuable not as standalone triggers, but as filters. If your technical system generates a buy signal while sentiment data shows extreme bullish positioning, that buy signal deserves extra scrutiny before execution.
The COT report, published weekly by the Commodity Futures Trading Commission, separates commercial hedgers from speculative positioning. Watching when large speculators reach historically extreme positions is one of the cleaner ways to time medium-term reversals in commodity and currency markets.
8. Quantitative and algorithmic signals
Quantitative signals range from simple rule-based mechanical triggers to sophisticated machine learning classifiers. Rule-based systems define entry and exit conditions in explicit code, making them fully testable against historical data. An example: "Go long when the 10-day moving average crosses above the 50-day moving average AND RSI is below 60 AND volume is above the 20-day average volume."
Model-based signals go further. ML models can classify LONG, SHORT, or HOLD positions using 51 or more features simultaneously, a level of pattern recognition no human can replicate manually. The tradeoff is interpretability. When a gradient boosting model says "short," you often can't reconstruct the reasoning, which creates challenges for risk management and confidence calibration.
Signal pooling addresses a different problem: individual signals have small edges, but combining multiple weak signals into a meta-signal improves reliability. A signal pool triggers trades only when more than 67% of its component signals agree, filtering out low-conviction setups.
Pro Tip: Before deploying any algorithmic signal in live markets, walk-forward test it on out-of-sample data. A strategy that looks great on backtested data but degrades rapidly on new data is likely overfit to historical noise, not a real edge.
9. Signal comparison by category
| Signal type | Time horizon | Primary data | Complexity | Best for |
|---|---|---|---|---|
| Trend indicators | Short to medium term | Price | Low | Trend-following systems |
| Momentum indicators | Short term | Price velocity | Low | Entries and divergence trades |
| Volatility indicators | Short term | Price range | Low to medium | Stop sizing, breakout timing |
| Volume signals | Short to medium term | Volume | Medium | Confirming price moves |
| Chart patterns | Short to medium term | Price structure | Medium | Context and reversal setups |
| Fundamental signals | Medium to long term | Economic data | High | Directional bias, macro trades |
| Sentiment signals | Short to long term | Positioning data | Medium | Fade extremes, filter entries |
| Quantitative/ML signals | Any | Multi-factor | High | Systematic, automated strategies |
The right trading strategy determines which signal categories belong in your stack. A scalper needs momentum and volume. A macro swing trader needs fundamentals and sentiment. Trying to use every category simultaneously is how traders end up paralyzed.
What experience actually teaches you about trading signals
I've watched traders build elaborate signal dashboards with fifteen indicators across six timeframes, and I've seen simple two-indicator systems outperform them consistently. The lesson I keep coming back to is this: more signals don't create more clarity. They create more reasons to hesitate.
The one thing I'd push back on in most guides covering this topic is the framing that signal selection is primarily a technical problem. It isn't. It's a psychological one. The traders I've seen struggle aren't missing a better indicator. They're missing conviction in the signals they already have, which makes them override good signals and hold losing trades.
What actually works, from what I've observed and experienced, is choosing 2 to 4 complementary indicators that cover different aspects of market behavior, then learning their failure modes cold. Know exactly when your signal setup gives false positives. That awareness alone is worth more than adding a fifth indicator.
The latency issue is also underappreciated at the individual trader level. I've seen technically sound signals go unprofitable because execution was slow. If you are trading real-time signals in fast markets, the infrastructure behind execution matters as much as the signal quality itself.
— James
How Apextradellc puts these signals to work for you
Understanding signal categories is step one. Executing them consistently, across assets, around the clock, is where most traders struggle on their own.
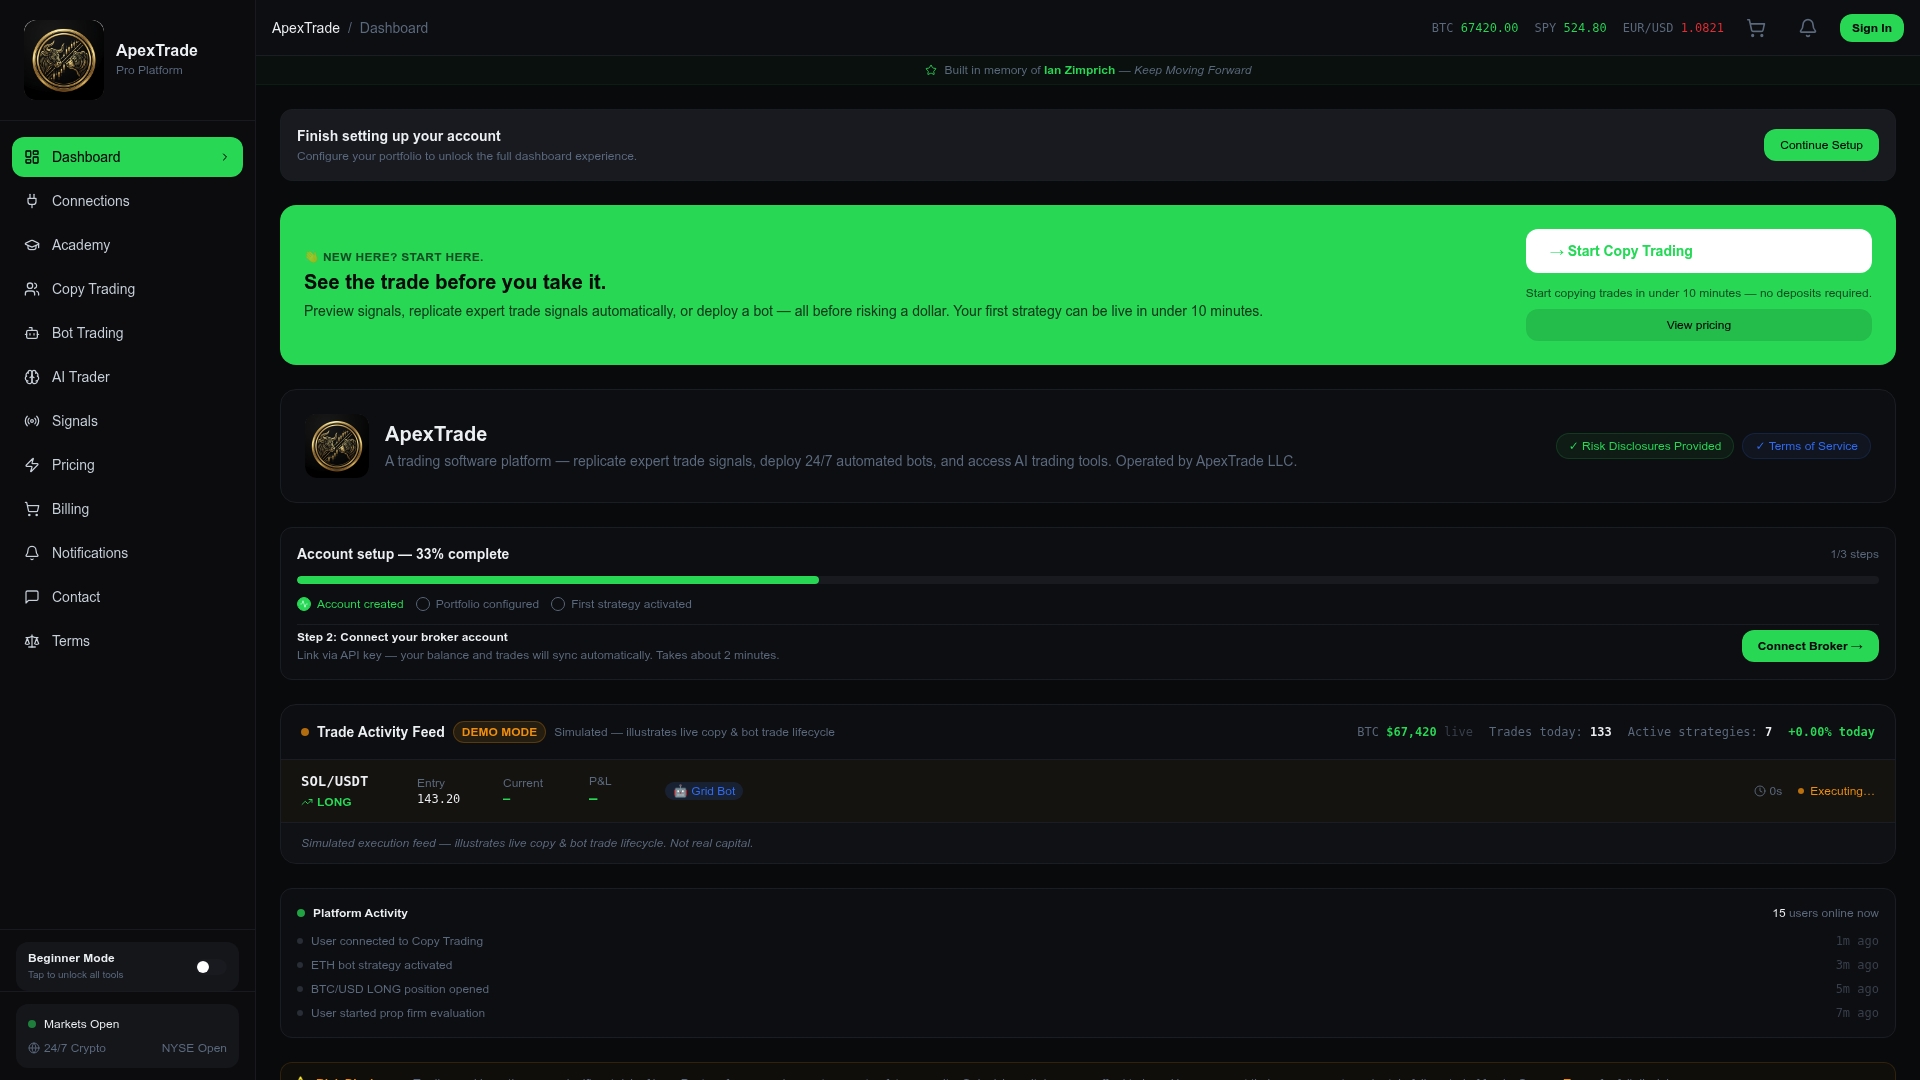
Apextradellc gives you the infrastructure to act on all the signal types covered here without building everything from scratch. The bot trading platform lets you deploy rule-based and algorithmic strategies that run 24/7, capturing signals in crypto, forex, and stock markets even when you're offline. For traders who prefer to follow proven signal sources directly, copy trading on Apextradellc replicates the trades of successful operators in real time. Both tools are built with risk controls and execution speed as core requirements, not afterthoughts.
FAQ
What are the main types of trading signals?
The four primary categories are technical, fundamental, sentiment, and quantitative signals. Each draws from a different data source and suits different trading styles and time horizons.
How many signals should a trader use at once?
Research supports using 2 to 4 complementary indicators rather than many simultaneous signals. Using signals from the same family adds false confirmation rather than genuine insight.
What makes a trading signal reliable?
A reliable signal specifies a direction, entry point, stop-loss level, and take-profit target. Signals that only indicate buy or sell without risk parameters are incomplete and harder to trade consistently.
What are automated trading signals?
Automated trading signals are generated by rule-based algorithms or machine learning models that scan market data continuously and output trade triggers without human discretion, enabling 24/7 execution.
How do sentiment signals differ from technical signals?
Technical signals read price and volume data, while sentiment signals measure trader positioning and crowd psychology. Sentiment is most useful as a filter for extreme conditions, not as a primary entry trigger.