
Choosing the right indicators for automated trading is where most algorithmic strategies succeed or fail before a single order fires. With hundreds of technical indicators available across any modern charting platform, the temptation is to layer in as many as possible. That approach backfires. Effective automated systems run on a tight, purposeful stack of indicators that each serve a distinct role, produce clear signals, and translate directly into executable rules. This guide breaks down how to select, evaluate, and combine the best indicators for trading algorithms in 2026.
Table of Contents
- Key takeaways
- How to choose indicators for automated trading systems
- The top technical indicators for trading algorithms
- 1. Moving averages (MA and EMA)
- 2. Relative Strength Index (RSI)
- 3. MACD (Moving Average Convergence Divergence)
- 4. Bollinger Bands
- 5. Stochastic Oscillator
- 6. Average True Range (ATR)
- 7. Fibonacci Retracement
- 8. On-Balance Volume (OBV) and the Accumulation/Distribution Line
- Comparing indicators by automation readiness
- How to combine indicators and implement them effectively
- My take on indicator selection and what most traders get wrong
- Put your indicator strategy to work with Apextradellc
- FAQ
Key takeaways
| Point | Details |
|---|---|
| Functional categories matter | Select indicators across trend, momentum, and volume categories to avoid redundant signals. |
| Signal clarity drives automation | Automated systems need deterministic, rule-based signals, not ambiguous readings. |
| Backtest with real costs | Zero-commission defaults inflate results; model actual slippage and fees before going live. |
| Fewer indicators, better results | A focused stack of 2 to 3 complementary indicators consistently outperforms overcrowded setups. |
| Risk rules matter as much as signals | Position sizing, stop-loss, and take-profit logic are just as critical as the indicator signals themselves. |
How to choose indicators for automated trading systems
Before you evaluate any specific indicator, you need a framework for what makes an indicator automation-ready. Not every technical indicator for trading translates cleanly into code. Some require discretionary interpretation that a human does intuitively but an algorithm cannot replicate.
Start by thinking in three functional categories. Every indicator in your stack should fall into one of these roles:
- Trend/Direction: Tells the algorithm which way the market is moving. Examples include moving averages and ADX.
- Momentum/Timing: Tells the algorithm how strong the move is and flags potential reversals. Examples include RSI and MACD.
- Volume/Confirmation: Validates whether price action has real buying or selling pressure behind it. Examples include On-Balance Volume (OBV) and the Accumulation/Distribution Line.
Traders combine 2 to 4 complementary indicators rather than relying on a single signal, and the research backs this up for good reason. Stacking three RSI-type oscillators tells you nothing that one RSI doesn't already say. The goal is cross-category confirmation, not redundancy.
For an algorithm to work, every signal must be deterministic. "Price looks like it might reverse" cannot be coded. "RSI crosses above 30 while OBV is trending upward" absolutely can. Your entry criteria, stop-loss levels, and take-profit targets all need to be expressed as precise numerical thresholds or crossover conditions that a bot can evaluate in real time.
Pro Tip: Map each indicator signal to a specific order parameter before you write a single line of code. If you cannot state the exact entry price, stop-loss level, and take-profit target that the indicator implies, the signal is not ready for automation.
Once your framework is in place, you can evaluate individual indicators with much more clarity.
The top technical indicators for trading algorithms
Here is a practical breakdown of the indicators that consistently perform in automated systems. Each one has a distinct role, a clear automation use case, and known limitations worth coding around.

1. Moving averages (MA and EMA)
Moving averages are the foundation of most trend-following algorithms. The Simple Moving Average (SMA) smooths price over a defined period, while the Exponential Moving Average (EMA) weights recent prices more heavily, making it faster to react. Common automation signals include the 50/200 EMA crossover for long-term trend detection and the 9/21 EMA crossover for shorter-term entries. Moving averages lag by definition, which means they confirm trends rather than predict them. That lag is acceptable in automated systems as long as your stop-loss accounts for it.
2. Relative Strength Index (RSI)
RSI is a momentum oscillator that measures the speed and magnitude of recent price changes on a scale from 0 to 100. Readings above 70 signal overbought conditions; readings below 30 signal oversold. For automation, RSI crossovers at these thresholds become discrete buy or sell triggers. One important caveat: RSI can stay in overbought or oversold territory for extended periods during strong trends, which means pairing it with a trend filter like ADX significantly improves signal quality. Combining RSI with volume indicators reduces false signals by up to 35%, making it a natural pairing with OBV.
3. MACD (Moving Average Convergence Divergence)
MACD combines trend and momentum into a single indicator by measuring the difference between two EMAs and plotting it against a signal line. When the MACD line crosses above the signal line, the algorithm reads a bullish condition. When it crosses below, bearish. The histogram adds another layer by showing the rate of change in that gap. MACD is well-suited for trend-following automation because it uses EMA math that bots can replicate exactly. The downside is that it generates more false signals in sideways markets, which is why it pairs well with volume confirmation.
4. Bollinger Bands
Bollinger Bands place two standard deviation envelopes above and below a 20-period SMA. When price touches the upper band, the market is statistically extended to the upside. When it touches the lower band, it is extended to the downside. Automated strategies use Bollinger Bands in two distinct ways: mean-reversion systems fade the touches, while breakout systems go long when price closes decisively outside the bands after a period of compression. Band width itself is a useful volatility signal that can trigger or suppress other indicators in your stack.
5. Stochastic Oscillator
The Stochastic Oscillator compares a closing price to the price range over a defined lookback period, expressing the result as a percentage between 0 and 100. Like RSI, it generates overbought signals above 80 and oversold signals below 20. The key automation advantage is the %K and %D crossover within those zones, which provides a discrete, codeable trigger. The Stochastic is more sensitive than RSI, which produces faster signals but also more noise. In automated systems, it works best on higher timeframes where the extra sensitivity does not generate excessive trade frequency.
6. Average True Range (ATR)
ATR does not generate directional signals. What it does is measure volatility, expressed as the average range between high, low, and close over a defined period. For automation, ATR is indispensable for dynamic position sizing and stop-loss placement. A trailing stop set at 1.5x ATR adapts to market conditions automatically rather than using a fixed dollar or percentage value. Any well-designed automated trading system uses ATR to scale risk per trade rather than applying uniform position sizes regardless of current market conditions.
7. Fibonacci Retracement
Fibonacci levels identify potential support and resistance zones based on key ratios: 23.6%, 38.2%, 50%, and 61.8%. In automated systems, Fibonacci retracements define entry zones after pullbacks within a confirmed trend. The 61.8% level in particular has a strong historical track record as a bounce zone in trending markets. For automation, the levels must be defined programmatically using swing high and swing low identification logic. Some platforms handle this natively, while others require custom scripting.
8. On-Balance Volume (OBV) and the Accumulation/Distribution Line
Volume-based indicators confirm whether price moves have conviction behind them. OBV adds volume on up days and subtracts it on down days, creating a running total that should trend in the same direction as price. When OBV diverges from price, that divergence is a warning sign for the algorithm. The Accumulation/Distribution Line goes further by factoring in where price closes within the day's range, not just whether the day was up or down. Cross-category confirmation using volume is non-negotiable for high-probability automated setups.
Comparing indicators by automation readiness
Not all market indicators for trading are equally suited for algorithmic deployment. This table summarizes the key attributes that matter when building automated trading systems.
| Indicator | Category | Signal Type | Lag | Best Automation Use Case |
|---|---|---|---|---|
| EMA Crossover | Trend | Lagging | High | Trend-following entry triggers |
| RSI | Momentum | Leading | Low | Reversal detection and filters |
| MACD | Trend + Momentum | Moderate | Medium | Trend confirmation and entry |
| Bollinger Bands | Volatility | Leading | Low | Breakout and mean-reversion systems |
| Stochastic | Momentum | Leading | Low | Short-term momentum entries |
| ATR | Volatility | Lagging | Medium | Position sizing and stop placement |
| Fibonacci | Support/Resistance | Static | None | Pullback entry zones |
| OBV | Volume | Leading | Low | Signal confirmation and divergence |
One filter that often goes unmentioned in standard lists: adding ADX above 25 as a condition before acting on moving average or MACD signals improves win rates by 22 to 28% by filtering out signals generated in range-bound conditions. That is one of the most practical adjustments you can make to a basic trend-following bot.
How to combine indicators and implement them effectively
The most effective indicator tools for traders in automated systems are not the most sophisticated ones. They are the ones that work cleanly together across the three functional categories discussed earlier.
A practical starter stack for a trend-following automated strategy might look like this:
- Trend filter: EMA crossover (50/200) to establish directional bias
- Momentum trigger: RSI crossing above 30 in an uptrend or below 70 in a downtrend
- Volume confirmation: OBV trending in the same direction as the trade
- Risk management: ATR-based stop-loss and take-profit levels
When connecting these signals to an automated bot, the workflow matters as much as the indicators themselves. Automating TradingView strategies involves translating indicator alerts into structured webhook payloads that include the symbol, trade direction, quantity, stop-loss price, and take-profit price. Every field in that payload must be explicitly defined by your strategy rules. Ambiguous signals break automation.
TradingView strategy alerts use webhooks to deliver JSON messages containing symbol, side, quantity, stop-loss, and take-profit fields for precise order execution. None of those fields populate themselves. Each one requires an explicit rule in your strategy.
Backtesting is where most automated strategies get overconfident. Default backtest settings in TradingView use zero commission and zero slippage, which inflates performance estimates significantly. A strategy that shows 40% annual returns in backtesting may deliver 25% to 30% after modeling 1 to 3 ticks of slippage and actual commission costs. Always run your backtests with realistic cost parameters before treating results as valid.
Pro Tip: Run your backtest on at least two years of data across different market regimes, including trending periods and choppy sideways periods. A strategy that only works in trending conditions is a seasonal system, not a reliable algorithm.
The most common pitfall in building effective trading indicators into bots is over-optimization. When you tune every parameter to match historical data, the system fits the past perfectly and performs poorly going forward. Use out-of-sample testing periods to validate that your indicator logic holds up on data the algorithm has never seen.
My take on indicator selection and what most traders get wrong
I've reviewed a lot of automated trading setups over the years, and the same pattern keeps showing up. Traders spend 80% of their time debating which indicator is "the best" and almost no time on the rules that translate that indicator into actual order execution.
In my experience, the indicators themselves rarely separate winning systems from losing ones. What separates them is position sizing, risk-per-trade consistency, and realistic stop-loss placement. A system built on three solid indicators with tight risk rules will outperform a system using ten indicators with poorly defined exits every time.
The other mistake I see constantly is treating backtesting results as a promise. Backtest performance inflation from zero-slippage assumptions can reduce real-world net profit by 8% or more compared to idealized results. That gap closes when you model real execution costs, but most traders do not bother until after they have deployed capital.
My honest recommendation: start with fewer indicators than you think you need. Two or three well-chosen indicators from different categories, paired with clear risk rules, will teach you more about automated trading than any complex multi-indicator system. Complexity is a way of hiding uncertainty about whether the strategy actually works.
— James
Put your indicator strategy to work with Apextradellc
Once you have your indicator stack defined and your rules mapped out, the next challenge is deploying them in a system that actually executes reliably around the clock.
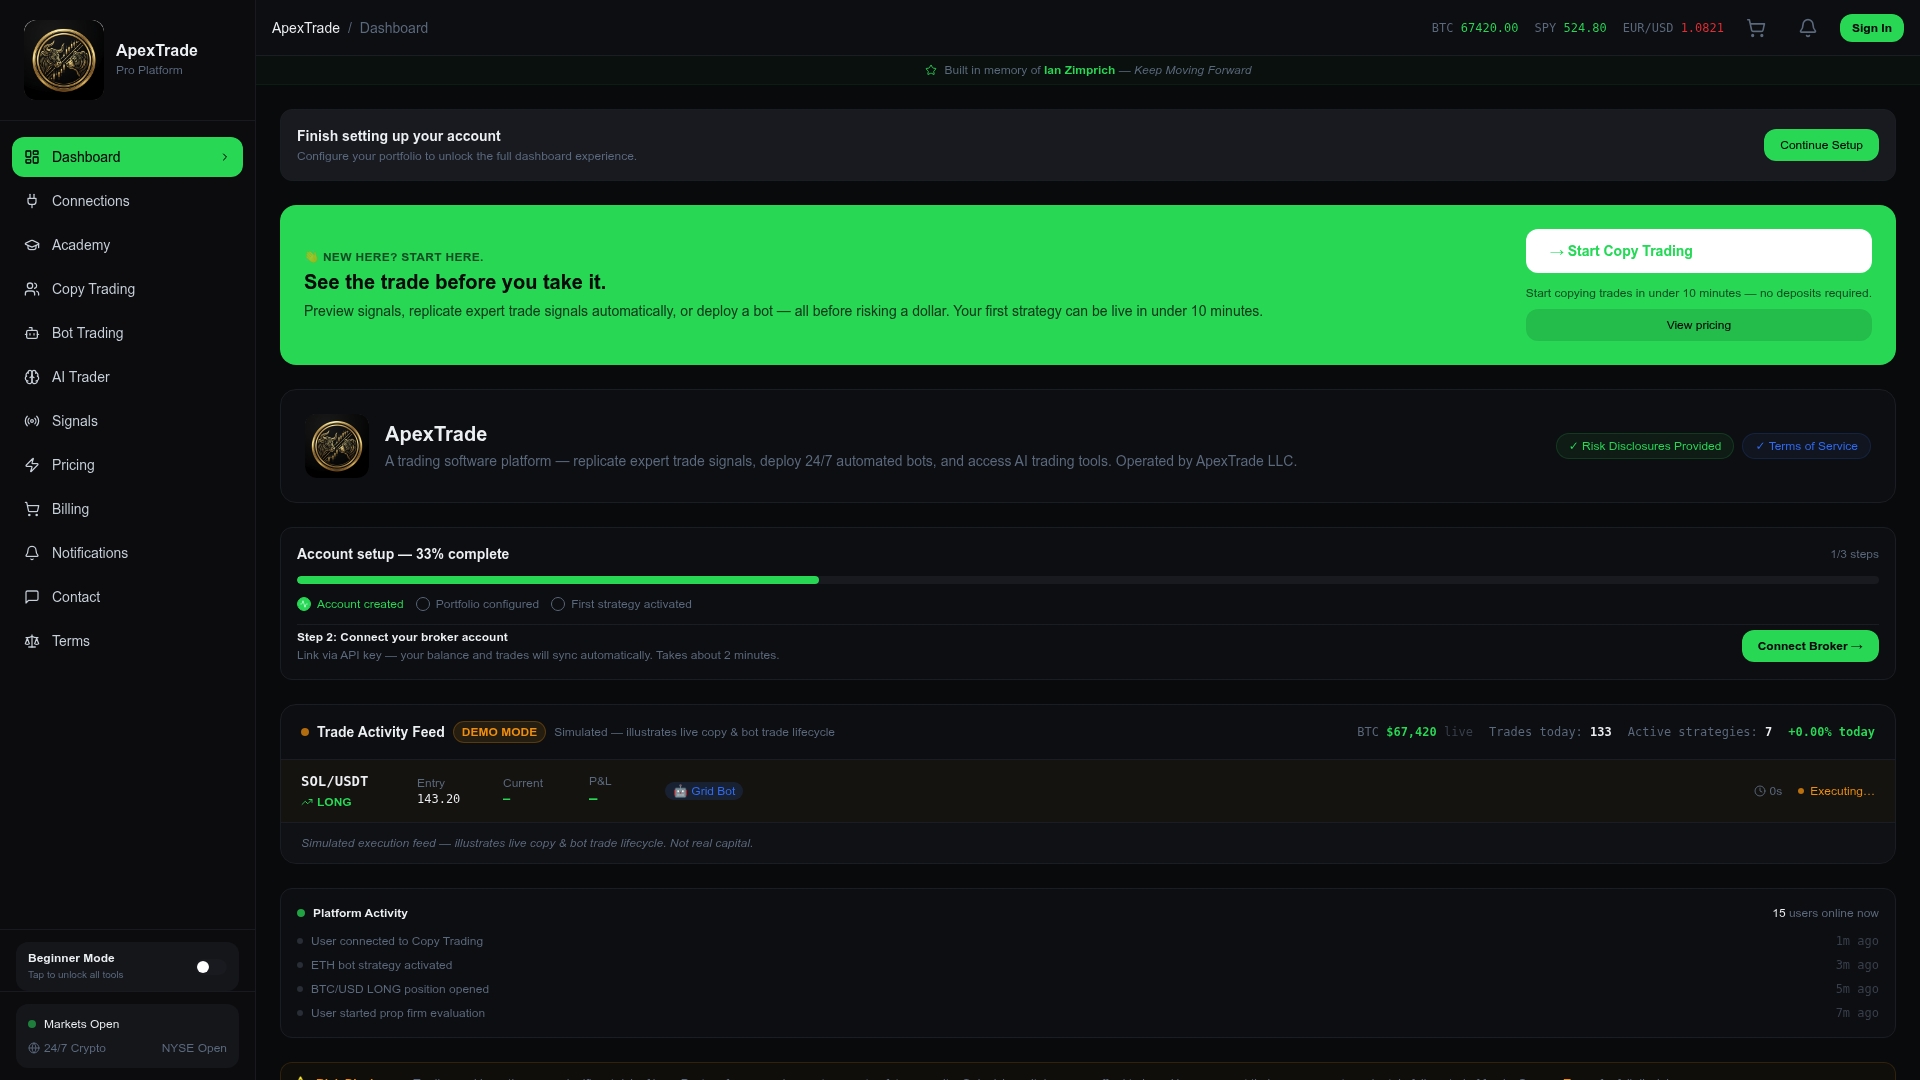
Apextradellc is built specifically for traders who are ready to move from indicator theory to live automation. The bot trading platform supports indicator-driven algorithms for crypto, stocks, and forex, with TradingView integration and webhook support so your signals translate directly into executed orders without manual intervention. You can also use copy trading to replicate strategies from proven traders while you refine your own indicator setups. Whether you are deploying a first automated strategy or managing multiple bots across asset classes, Apextradellc provides the infrastructure to run those systems efficiently and securely 24/7.
FAQ
What are the best indicators for automated trading?
The best combination typically includes a trend indicator like EMA crossovers, a momentum indicator like RSI or MACD, and a volume confirmation tool like OBV. Cross-category stacks produce more reliable signals than loading up on multiple indicators from the same category.
How do I automate trading signals from indicators?
You map each indicator signal to a specific order parameter, then deliver that data via a webhook payload containing the symbol, trade direction, quantity, stop-loss, and take-profit fields. Platforms like TradingView support this workflow natively through strategy alerts.
Why do backtests overestimate my strategy's performance?
Most backtesting tools default to zero commission and zero slippage, which inflates performance metrics by 20% or more compared to real trading conditions. Modeling realistic execution costs before going live gives you a much more accurate picture.
How many indicators should an automated strategy use?
Research and practice both point to 2 to 4 complementary indicators as the sweet spot. More than four typically creates conflicting signals and over-optimization without improving performance.
Can momentum indicators like RSI stay in overbought zones too long?
Yes, and it is a real automation risk. Momentum oscillators can remain in extreme zones for extended periods during strong trends, which is why pairing RSI or similar indicators with a trend filter like ADX filters out misleading reversal signals in those conditions.