

Trade history is the complete record of every executed transaction in a trading account, including entry and exit prices, volumes, fees, and timestamps. Unlike a general order log, it captures only the trades that actually filled, making it the most reliable data source for measuring real performance. Traders who understand what trade history contains, and how to analyze it systematically, gain a measurable edge over those who rely on memory or gut instinct. Platforms like Apextradellc, Tradervue, and Edgewonk are built around this principle: your executed trade data tells the truth about your strategy, even when your memory does not.
What is trade history vs. order history?
The distinction between these two records is one of the most misunderstood concepts in retail trading, and getting it wrong corrupts your analysis from the start.
Trade history logs executed trades only, meaning every entry in the record represents a transaction that cleared at a specific price and time. Order history, by contrast, captures the full lifecycle of every order you placed, including orders that were cancelled, expired, or partially filled. The practical difference matters enormously when you are trying to calculate true net profit and loss, because cancelled orders carry no financial consequence but can inflate the apparent volume of your activity.
Here is how the two records differ in practice:
- Trade history: Records filled price, volume, fees, and net proceeds for every completed transaction
- Order history: Records order placement time, order type, status changes, and cancellation events
- What trade history excludes: Pending orders, rejected orders, and any order that did not result in a fill
- What order history excludes: The actual financial impact of each transaction, since unfilled orders have no P&L
Pro Tip: When auditing your performance, always pull your trade history rather than your order history. Order history inflates apparent activity and can make a low-conviction trading period look busier than it was.
For tax reporting, compliance reviews, and strategy analysis, trade history is the authoritative source. Order history is useful for diagnosing execution problems, such as why a limit order never filled, but it cannot tell you whether your strategy is profitable.
Which key metrics reveal what your trade history is telling you?
Knowing how to track trade performance means knowing which numbers to calculate from your raw trade data. Five metrics cover the full picture of a strategy's health.
| Metric | What it measures | Benchmark |
|---|---|---|
| Net P&L | Total profit minus total fees and losses | Positive over 50+ trades |
| Win Rate | Percentage of trades closed at a profit | Meaningful only alongside Profit Factor |
| Profit Factor | Gross profit divided by gross loss | Above 1.3 is solid; above 1.5 is strong |
| Expectancy | Average dollar gain per trade across all outcomes | Must be positive to scale |
| Max Drawdown | Largest peak-to-trough decline in account equity | Under 15% for most retail risk profiles |
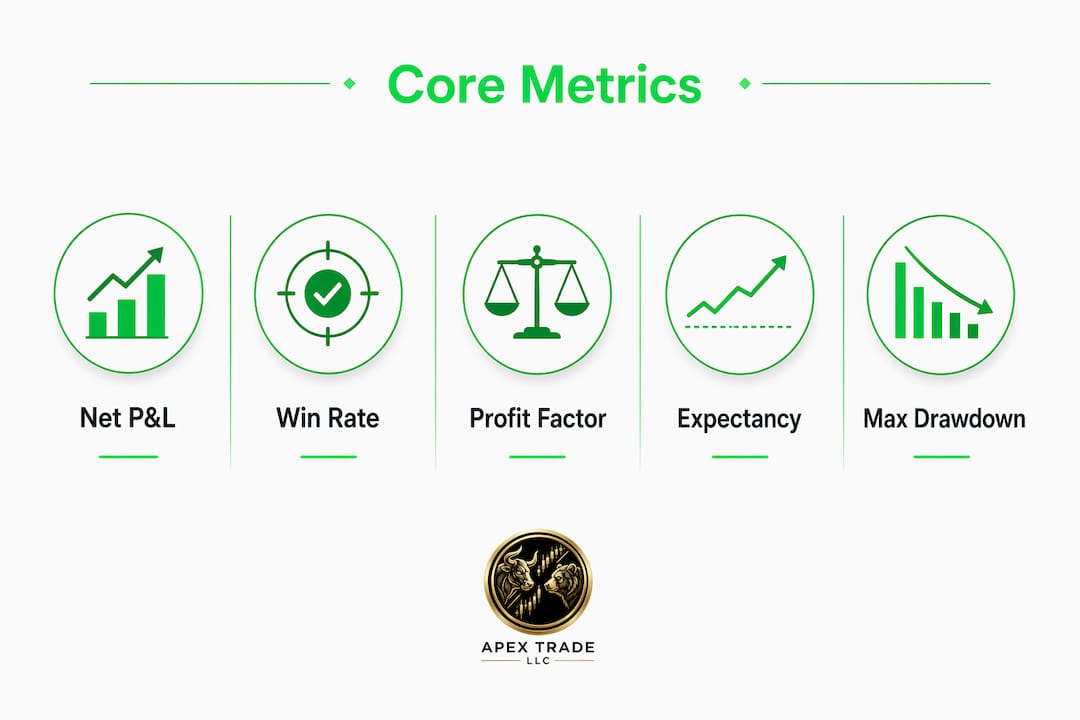
Profit Factor is the single most informative metric because it accounts for both frequency and magnitude of wins and losses simultaneously. A 70% win rate with a Profit Factor of 0.9 means you are losing money despite winning most trades. Expectancy translates that relationship into a per-trade dollar figure, which tells you whether scaling up position size makes mathematical sense.
Filtering your data is just as important as calculating these numbers. Filtering by setup, time slot, and ticker reveals which specific conditions produce your edge and which drain it. One setup may carry a Profit Factor of 2.0 while your aggregate number sits at 1.1, meaning other setups are quietly destroying the gains from your best one.
Pro Tip: Run your five core metrics separately for each distinct setup you trade. Aggregate numbers hide the truth. The goal of tracking trade performance is to find the setups worth scaling and the ones worth eliminating.
How do modern trading journals use AI to deepen trade history analysis?
Raw broker data tells you what happened. AI-enhanced trading journals tell you why, and that distinction separates traders who improve from those who repeat the same mistakes.
Top-tier platforms integrate with 80+ brokers and use AI to tag emotional states, rule adherence, and behavioral patterns across your trade history. Tools like Tradervue and TradeJournal.ai go beyond data aggregation by identifying patterns in FOMO-driven entries, revenge trading sequences, and rule violations that correlate with losing streaks. This is a fundamentally different approach to understanding trade history than simply reviewing a spreadsheet.
The core advantages of AI-integrated journaling include:
- Automated data import from dozens of brokers, eliminating manual entry errors and ensuring your trade history is complete
- Emotional tagging that links subjective states at trade entry to objective outcomes, revealing whether fear or overconfidence correlates with your worst trades
- Rule adherence tracking that flags every trade where you deviated from your written plan, building a compliance record alongside your financial record
- Pattern discovery across hundreds of trades, surfacing setups and time windows that outperform without requiring you to build custom filters manually
Human memory distorts trade rationale within days of execution, which is why near-real-time annotation is the standard in professional journaling. A trade you remember as "a clean breakout entry" may have actually been an impulsive entry after a losing streak. The journal captures the truth; your memory does not.
Platforms like Edgewonk provide over 100 reports and automatic imports, enabling granular filtering by ticker, time slot, and strategy type. This level of detail transforms your trade history from a passive record into an active coaching tool. You can also explore how AI shapes trading decisions more broadly to understand the technology behind these features.
Why historical trade data is the foundation of backtesting
Backtesting is the process of applying a trading strategy to historical price data to simulate how it would have performed before you risk real capital. Your own trade history plays a dual role in this process: it provides the raw data for analysis and serves as the benchmark against which simulated results are measured.
Here is how traders use historical trade data across the backtesting workflow:
- Strategy definition: Use your trade history to identify the specific entry and exit conditions that produced your best Profit Factor results, then codify those conditions into a testable rule set.
- Historical simulation: Apply that rule set to past market data spanning multiple market cycles, including trending, ranging, and high-volatility environments.
- Performance comparison: Compare the simulated results against your live trade history to identify gaps between theoretical and actual execution, including slippage and fee drag.
- Edge validation: Confirm that the statistical edge visible in your live data holds across different time periods before increasing position size or automating the strategy.
- Continuous refinement: Feed new live trade data back into the backtesting model regularly, updating your assumptions as market conditions evolve.
Trade history data spanning decades is the foundation of quantitative trading, where firms like Renaissance Technologies and Two Sigma built their strategies on precisely this kind of systematic historical analysis. For individual traders, the principle is identical even if the scale is smaller. A strategy with a two-year live trade history and a confirmed backtest across ten years of data carries far more credibility than one based on six months of results. Apextradellc's backtesting resources explain how this process applies directly to automated bot strategies.
Key takeaways
Trade history is the executed transaction record that drives every meaningful decision about strategy improvement, risk management, and capital allocation.
| Point | Details |
|---|---|
| Trade history vs. order history | Trade history records only filled transactions; order history includes cancelled and pending orders. |
| Five core metrics | Net P&L, Win Rate, Profit Factor, Expectancy, and Max Drawdown give a complete picture of strategy health. |
| Filter before concluding | Aggregate metrics mislead; filtering by setup and ticker reveals which conditions actually produce an edge. |
| AI journals add context | Emotional tagging and rule adherence tracking explain why trades succeed or fail, not just whether they did. |
| Backtesting requires history | Validating a strategy across historical trade data before scaling is the standard practice in quantitative trading. |
The uncomfortable truth about trade history most traders ignore
I have reviewed trade histories from dozens of traders over the years, and the pattern is consistent: the traders who struggle most are not the ones with bad setups. They are the ones with too many setups, too many tickers, and no filter discipline. Their trade history looks busy. Their P&L does not reflect that activity.
The insight that changed how I think about this comes from a principle that unmade trades preserve capital just as effectively as good entries generate it. The trades you chose not to take never appear in your history, which means your journal has a structural blind spot. You can only see what you did, not what you wisely avoided. Fixing that requires a separate log of skipped setups, which almost no one maintains.
The second issue is journaling persistence. Effective journaling captures decision context and emotional states that decay from memory within days, yet most retail traders quit journaling within the first month because they treat it as administrative work rather than the analytical process it actually is. The traders I have seen improve fastest are the ones who annotate trades within hours of closing them, not at the end of the week.
My honest recommendation: treat your trade history as a performance contract with yourself. Every entry is evidence. Every pattern is a signal. The analysis is not optional if you want to improve.
— James
How Apextradellc supports your trade history and performance tracking
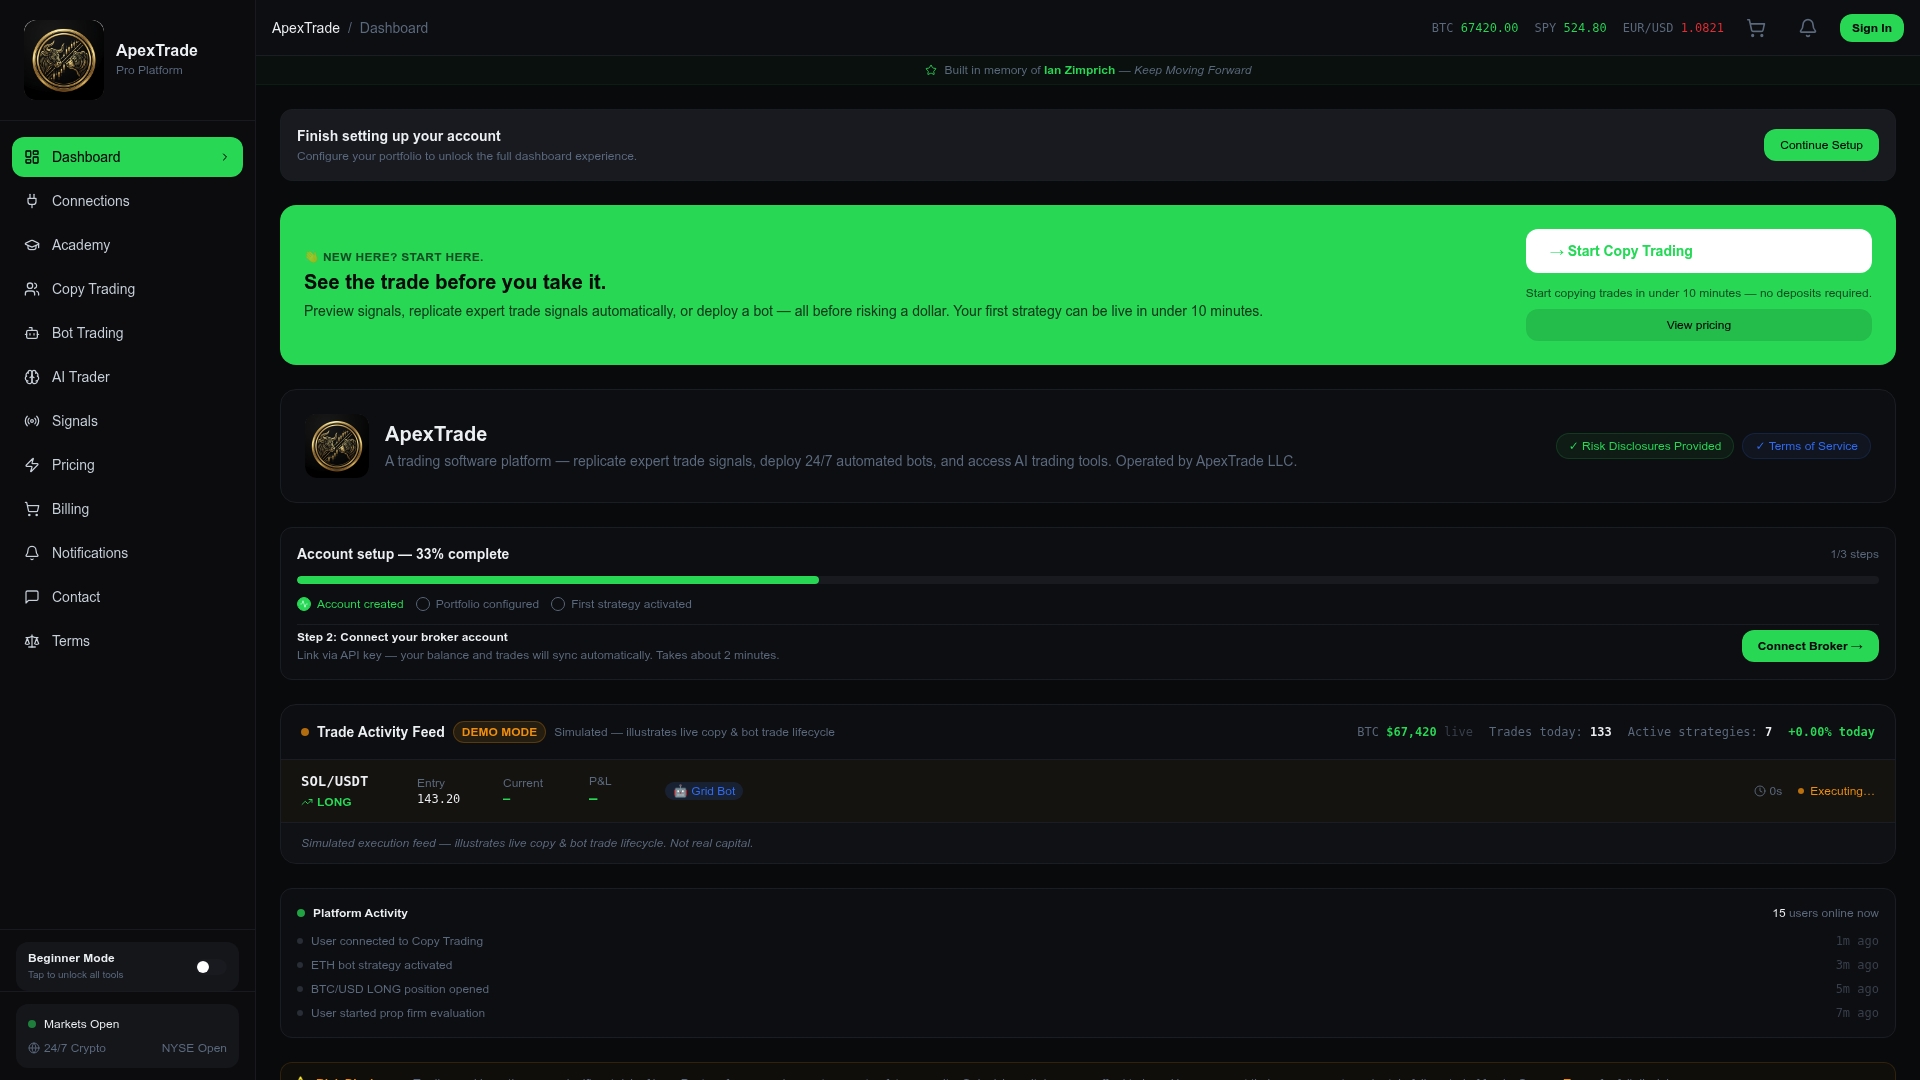
Apextradellc is built for traders who take their trade history seriously. The platform's bot trading tools execute strategies around the clock and generate a clean, timestamped trade history that feeds directly into performance analysis. Every automated trade is logged with full transaction detail, giving you the data quality that manual trading rarely produces.
For traders who want to learn from proven strategies, Apextradellc's copy trading feature replicates the trade history of successful traders in real time, letting you study their execution patterns while building your own record. The platform covers cryptocurrencies, stocks, and forex, so your trade history reflects a diversified view of your performance across asset classes. Explore the full suite of trading tools on Apextradellc to see how automated execution and performance tracking work together.
FAQ
What is trade history in simple terms?
Trade history is the record of every completed buy or sell transaction in your account, including prices, volumes, and fees. It excludes cancelled or pending orders, making it the most accurate source for calculating real trading performance.
How is trade history different from order history?
Trade history records only filled transactions, while order history captures every order placed regardless of whether it executed. Use trade history for P&L analysis and order history for diagnosing execution issues.
What metrics should I track in my trade history?
The five metrics that matter most are Net P&L, Win Rate, Profit Factor, Expectancy, and Max Drawdown. A Profit Factor above 1.3 indicates a solid strategy, and filtering these metrics by setup type reveals your true statistical edge.
Why should I monitor my trading performance regularly?
Memory distorts trade rationale quickly, so regular review of your trade history while context is fresh produces more accurate insights. Consistent monitoring also catches deteriorating metrics before they compound into significant losses.
How does trade history support backtesting?
Historical trade data provides the benchmark for simulating how a strategy would have performed across past market conditions. Comparing live trade history against backtested results identifies gaps in execution quality and validates whether a statistical edge is real or coincidental.